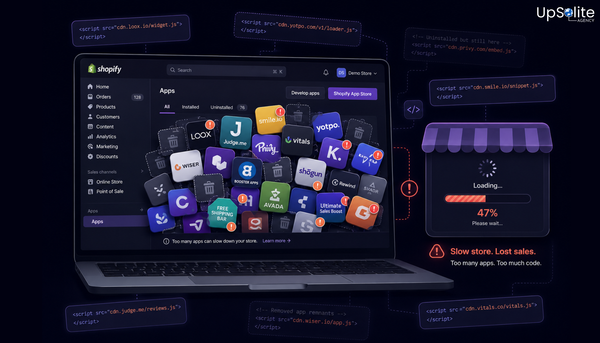
When we take on a new Shopify project, a performance audit is one of the first things we run. Not because clients always ask for it — but because it consistently reveals problems they didn't know they had.
The most common finding on stores running page builders: the product page is carrying far more weight than it should, and the merchant has no idea because everything looks fine in the editor. The editor is a warm, cached, pre-initialised environment. A real customer on a real mobile connection gets none of that.
What Actually Loads — and in What Order
When a first-time visitor hits a page-builder PDP, here's the sequence the browser works through before anything meaningful appears on screen:
- HTML document received from Shopify's servers
- Page builder core JavaScript bundle requested and downloaded — 100–300KB, blocks all rendering until complete
- Builder initialises and begins parsing your page layout
- Per-block scripts requested independently — reviews widget, sticky bar, countdown timer, image gallery each fire their own fetch
- Competing CSS files from multiple block sources create render-blocking queue
- Third-party embeds (if any) add their own network requests
- Your product image finally renders — this is the LCP event Google measures
On a fast desktop connection with a warm cache, most of this is invisible. On a mobile connection — first visit, cold cache — each step is a wait. By the time the product image loads, the page has already failed Google's LCP threshold and a measurable percentage of mobile visitors have bounced.
What We Find in a Typical Audit
Across stores we've audited running 3 or more page builder blocks, the pattern is consistent:
- JS payload on the product page: 400KB – 1MB+ (vs. 50–150KB on a native Liquid build)
- Network requests on the PDP: 15–40+ (vs. 3–10 on native)
- Total Blocking Time: 300–800ms — the period during which the browser is locked and can't respond to taps or clicks
- Mobile Lighthouse score: consistently below 50 on product pages vs. 70+ on other page types
That last point is telling. When product pages score significantly lower than the homepage or blog pages on the same domain, the page builder is almost always the differentiator. Other pages don't carry the builder's full overhead the way a heavily-blocked PDP does.
The Revenue Math Behind the Slowdown
Speed isn't a technical problem in isolation. It connects directly to commercial outcomes:
- Bounce rate increases 32% when load time moves from 1s to 3s
- A 1-second LCP improvement drives 2–4% higher conversion rates
- For a store doing $80K/month, a 2% conversion lift is $1,600/month in additional revenue — the page builder contributing to the slowdown costs $49/month
The slow LCP that's costing you conversions is also limiting your search rankings. That's a separate but connected problem — we cover the ranking impact specifically in How Page Builders Affect Your Shopify SEO.
Why the Editor Always Feels Faster
The builder preview runs with Shopify's infrastructure already warm, the builder pre-initialised in the browser, and all assets cached from the previous edit session. It's a fundamentally different environment from what a customer experiences. This is why merchants are often genuinely surprised by their real-world Lighthouse scores — the editor gave them no indication anything was wrong.
It's also why synthetic lab scores (Lighthouse run locally) often look better than field data from real users in Google Search Console. Real users have cold caches, varying connections, and device constraints that no editor environment replicates.
What Changes With Native Liquid
When we rebuild in native Shopify sections, the entire loading queue shrinks. There's no builder initialisation layer. No independent per-block script fetches. No competing CSS. The browser receives clean, server-rendered HTML and only loads the scripts that specific page genuinely needs.
The result isn't just a faster number — it's a lighter page that renders the product image sooner, responds to taps faster, and shifts less during load. The theme editor still works. Merchants can still update content without code. What changes is the architecture underneath — and that's what Google measures.
For the full picture on how this fits into a broader rebuild decision: Page Builder vs Native Shopify: Why Your Product Page Deserves Better.
Where to Look on Your Store Right Now
- ✅ Run your main PDP through PageSpeed Insights on mobile — note the LCP score and Total Blocking Time
- ✅ Check Google Search Console → Core Web Vitals — filter to product page URLs specifically
- ✅ Count the number of app blocks actively loading on your PDP
- ✅ Compare your PDP Lighthouse score to your homepage — a gap of 20+ points usually points to the builder
⚡ Every Second Your Product Page Takes Is Costing You
A slow product page compounds daily — every visitor who bounces before seeing your product, every ranking you don't earn, every conversion that doesn't happen. We audit stores, pinpoint exactly what's driving the drop, and fix it at the source. Get in touch and we'll run your numbers.